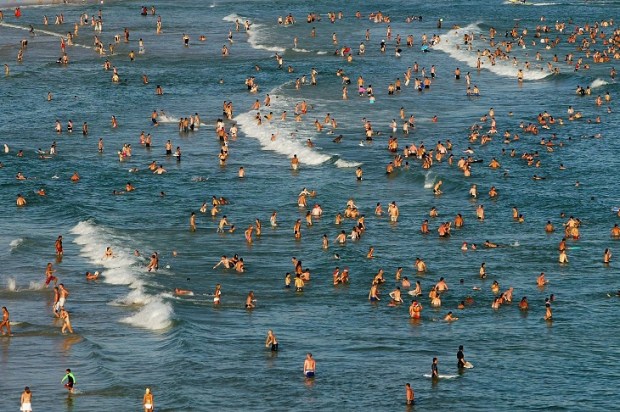
As I commence this post, I am currently ensconced in my office (okay, it’s a spare bedroom) in my home on the NSW far north coast, not 200 metres as the crow flies to the currently frothing ocean beyond. My scenario is not unique. There are many tens if not hundreds of thousands along this stretch of coast in a similar position, some with commanding views of said ocean. It’s mid-morning on Friday, March 7, and Tropical Cyclone Alfred looms large, if not through its physical presence then through the breathless reporting of it to the nation as a whole through all the usual media channels.
Outside, my house is being lashed by constant rain, around 60-80 mm in the last 24 hours, which is significant but bettered on more occasions over the decades than one could readily list. Some other locations nearby have topped 100 mm in last 24 hours but again this is not especially unusual. The current wind speed is averaging about 35 knots (65 km/h) out of the south-east with gusts approaching or just topping 100 km/h. This is the ‘whip tale’ to the south of the cyclone’s centre passing over me as I write and is the expected peak of wind conditions for my location south of the Queensland border. While not pleasant, these conditions are not ‘tear buildings apart’ kind of conditions, à la Cyclone Tracy. One power-line has come down in my coastal village and that was in a small side street over a day ago now and very few trees have fallen throughout the area although many branches have come unstuck.
It is already evident to me that TC Alfred, although still around 18 hours from landfall (at this stage) is not going to wreak untold destruction through its wind speeds, nary a roof will be lost. The maximum wind speeds TC Alfred will generate will be the kind of wind that is an every-other day occurrence in locations like Invercargill in New Zealand and King Island in Bass Strait. This is not to underestimate the impacts of flooding that TC Alfred may yet bring – this is by far its greatest threat, but images of cyclonic winds flattening everything in their wake will be conspicuous in their absence in the aftermath of Alfred, albeit undoubtedly some power lines will fall along with some large trees and power outages in some areas have all.
There is a reason why the stated Category 2 cyclone Alfred will be thankfully underwhelming in its destructive wind speeds and that reason rests with the Australian Bureau of Meteorology (BoM). You see, not all cyclones, typhoons, or hurricanes are created equal and one man’s tropical cyclone is nothing more than another man’s tropical depression or east coast low as many would be familiar with on the Eastern Seaboard of Australia. It may surprise many that the categorisation of cyclonic storms (including typhoons and hurricanes) varies in every major ocean basin around the world that has the potential to generate such storms. These ocean basins and the correlating categorisation system are as follows:
- The Atlantic, Central and Eastern Pacific – Saffir – Simpson Scale (US System)
- Western Pacific – JMA RSMC Tokyo Scale (Japanese System)
- North Indian Ocean – IMD RSMC New Delhi Scale (Indian System)
- South-West Indian Ocean – MFR RSMC La Reunion Scale (French System)
- Southern Pacific – ATCIS (Australian BoM System)
The important thing to note about all of these separate classification systems is that never the twain shall meet. That is to say that they are not interrelated in their approach making comparing the intensity of such storm systems from across the globe methodologically fraught. An example of differences in applied methodology are numerous across all systems, however, measurement or sustained winds used by most weather agencies is that of a 10-minute average at a height of 10 m (33 ft) above the sea surface. However, the Saffir–Simpson hurricane scale used by the US to measure the hurricanes that regularly impact areas around the Caribbean and the Gulf of Mexico (or should that read Gulf of America?) is based on maximum sustained wind speed measurements averaged over a one-minute period, at 10 m (33 ft). The scale used by (RSMC) New Delhi applies a three-minute averaging period, and the Australian scale is based on both three-second wind gusts and maximum sustained winds averaged over a 10-minute interval.
What is patently clear from what comparisons can be made across the differing categorisation systems is that in 1990 when the BoM introduced its current system, it chose to emasculate the parameters required to be classified as a cyclone.
TC Alfred is currently logged as a Category 2 cyclone under the BoM ATCIS with sustained wind speeds of approximately 40 – 45 knots (75 – 85km/h) close to its centre and gusts up to 53 knots (100km/h) directly off the coast further south and offshore from where I currently sit. Here is a comparison (as best as the differing methodologies will allow) with all the other listed categorisation systems as to where this would fit under those systems:
- Saffir-Simpson Scale (US System) – Tropical Storm (lower than a Category 1 system)
- JMA RSMC Tokyo Scale (Japanese System) – Between a Tropical Storm and Severe Tropical Storm category (lower than a Typhoon category)
- IMD RSMC New Delhi Scale (Indian System) – Cyclonic Storm (lower than severe Cyclonic Storm category)
- MFR RSMC La Reunion Scale (French System) – Between a Moderate Tropical Storm and Severe Tropical Storm (Lower than the Cyclonic Storm category)
As we can see above not all cyclones are created equal. Interestingly, it is an approach that has failed to deliver the alarmism hoped for as the data reveals cyclones off both the west and east coast of Australia have diminished in frequency over the last 80 years. The ‘weakening of the classification system however’ also assists in making the claim that what cyclones do occur are more severe than previously occurred. This is as equally disingenuous when utilising one-second digital temperature recordings to suggest maximum temperatures are increasing when comparing them with older mercury thermometer data is methodologically flawed. Apples and Oranges as they say.
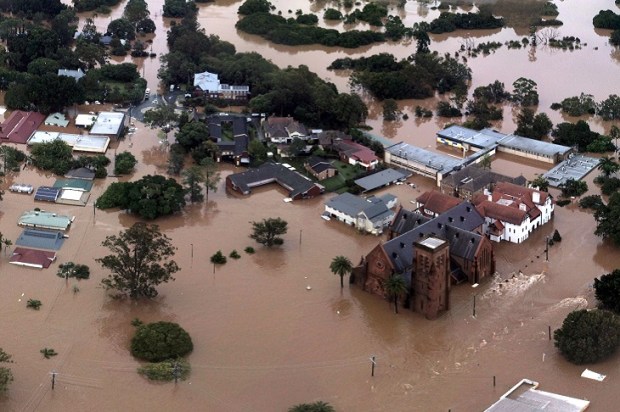
In 1954 a cyclone (of unknown intensity based on the above classification systems) crossed the Gold Coast and led to significant regional flooding and is believed to have directly led to the loss of approximately 30 lives, most of which occurred in the resultant flooding that impacted Lismore. In this regard TC Alfred represents no greater threat than the east coast low that flooded the region in 2022 and the monsoonal deluge that recently impacted Far North Queensland in so much that its wind strength is the least of its concerns and the ensuing rainfall, flooding and coastal storm surge are what will generate the greatest risks and potential damage.
For those who can’t help but try and ride the back of this storm in an attempt to score ‘Climate Change’ political points leveraged off the heartache of those who are left to clean up, both history and real scientific evidence is against you. This is not unprecedented.
Finally, for all those impacted by TC Alfred, our thoughts are with you – I might see you on the streets cleaning up.